ai journeys
Feature Feedback Analysis AI Journey
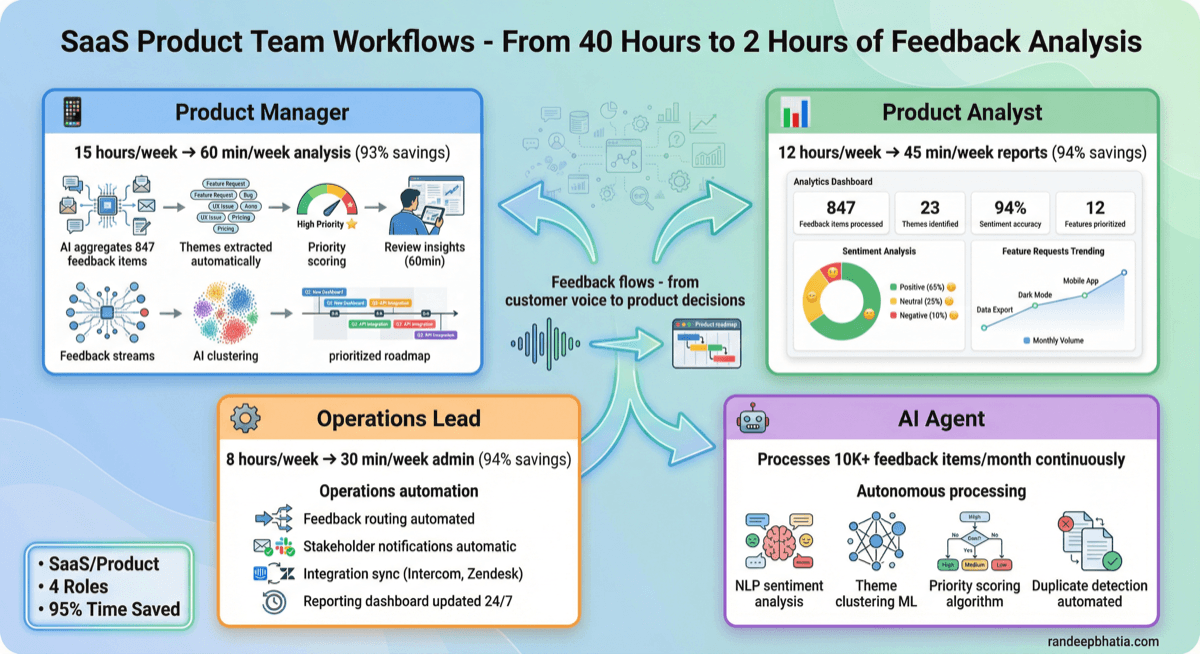
Role-based AI adoption journey for feature feedback analysis. Shows how different teams implement and benefit from AI solutions.
2025-05-21
View Full Size
Role-based AI adoption journey for feature feedback analysis. Shows how different teams implement and benefit from AI solutions.
2025-05-21