← Wednesday's Workflows

Predictive Maintenance System Architecture 🏗️
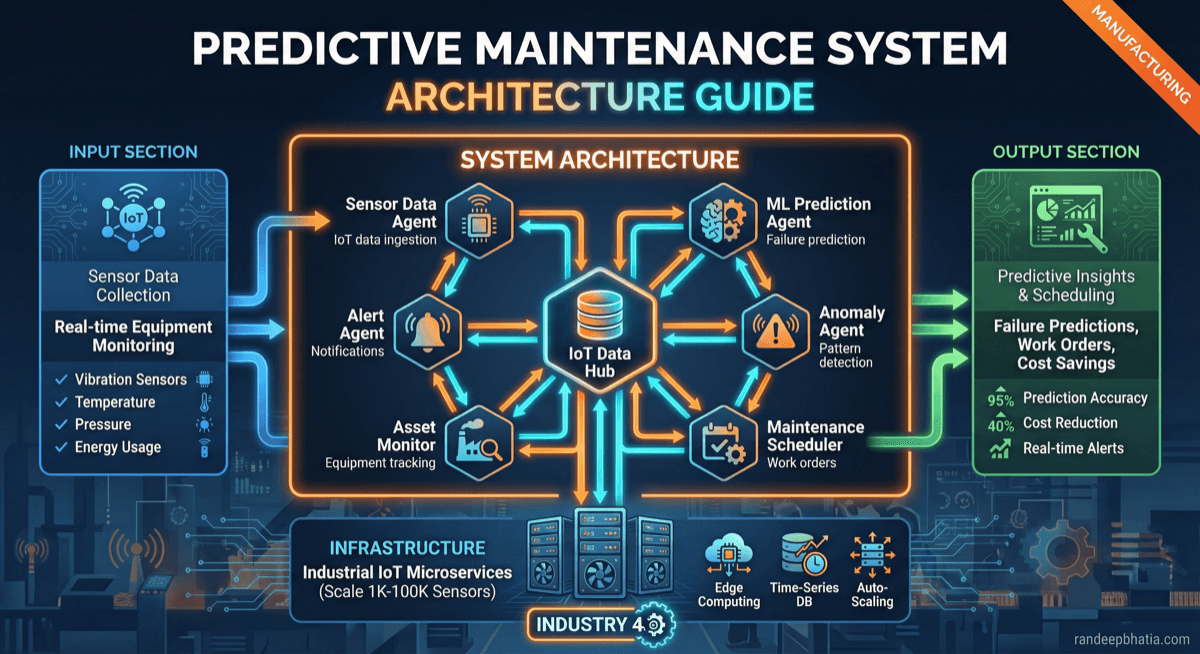
From 100 to 10,000 machines with 99.9% uptime and <10min failure prediction

May 1, 2025
16 min read
🏭 Manufacturing🏗️ Architecture📊 Scalable🤖 Multi-Agent⚡ Real-Time
🎯This Week's Journey

From sensor data to failure prediction in 10 minutes.

Monday: 3 core prompts (sensor analysis, failure prediction, maintenance scheduling). Tuesday: automated agent code. Wednesday: team workflows (plant managers, technicians, data engineers). Thursday: complete technical architecture. Components, data flows, ML pipelines, SCADA integration, and scaling patterns for 10,000+ machines.

📋

Key Assumptions

1
Monitor 100-10,000 industrial machines (pumps, motors, conveyors, CNC, etc.)
2
Sensor data: vibration, temperature, pressure, current, RPM (10Hz-1kHz sampling)
3
Integrate with existing SCADA/MES/CMMS systems
4
Compliance: ISO 55000 (asset management), SOC2, data residency
5
Target: 99.9% uptime SLA, <10min prediction lead time, <5% false positive rate

System Requirements

Functional

  • Ingest sensor data from 100-10K machines at 10Hz-1kHz
  • Detect anomalies in real-time (<1min latency)
  • Predict failures 10-60min in advance with 95%+ accuracy
  • Generate maintenance work orders in CMMS automatically
  • Provide root cause analysis and recommended actions
  • Support multi-site deployments with centralized monitoring
  • Historical trend analysis and reporting dashboards

Non-Functional (SLOs)

latency p95 ms800
freshness min1
availability percent99.9
prediction accuracy percent95
false positive rate percent5

💰 Cost Targets: {"per_machine_per_month_usd":15,"per_prediction_usd":0.02,"storage_per_machine_per_year_usd":120}

Agent Layer

planner

L4

Decompose maintenance tasks, route to specialized agents

🔧 anomaly_detector, failure_classifier, root_cause_analyzer

⚡ Recovery: If anomaly_detector fails → fallback to rule-based thresholds, If CMMS unavailable → queue work order for retry

executor

L3

Run anomaly detection and failure prediction models

🔧 fft_transformer, isolation_forest_model, lstm_failure_predictor

⚡ Recovery: If model inference timeout → use last known good prediction, If feature extraction fails → skip prediction, log error

evaluator

L3

Validate predictions, filter false positives, assess quality

🔧 false_positive_filter, domain_rule_engine, confidence_calibrator

⚡ Recovery: If validation inconclusive → flag for human review, If rule engine fails → default to conservative (allow prediction)

guardrail

L4

Enforce safety limits, policy checks, prevent unsafe actions

🔧 safety_policy_checker, production_impact_estimator, risk_calculator

⚡ Recovery: If policy check fails → block action, alert ops, If risk calc unavailable → default to safest action

root_cause_analyzer

L3

Diagnose failure root cause using sensor patterns and maintenance history

🔧 pattern_matcher, causal_inference_model, maintenance_kb_search

⚡ Recovery: If causal model fails → return top 3 likely causes, If KB search timeout → use generic recommendations

orchestrator

L4

Coordinate all agents, manage state, handle retries and fallbacks

🔧 all_agents, state_manager, retry_handler

⚡ Recovery: If agent fails → retry 3x with backoff, If multiple failures → degrade gracefully (skip non-critical agents)

ML Layer

Feature Store

Update: Real-time (1min batch) + daily batch recalculation

  • vibration_rms (root mean square)
  • vibration_fft_peaks (frequency domain)
  • temperature_rolling_avg_5min
  • current_draw_variance
  • rpm_deviation_from_baseline
  • pressure_rate_of_change
  • bearing_health_score (composite)
  • time_since_last_maintenance_hours
  • machine_age_days
  • production_load_factor

Model Registry

Strategy: Semantic versioning (major.minor.patch), immutable artifacts in S3

  • anomaly_detector_v3
  • failure_classifier_lstm_v2
  • ttf_predictor_xgboost_v1
  • root_cause_bert_v1

Observability Stack

Real-time monitoring, tracing & alerting

0 active
SOURCES
Apps, Services, Infra
COLLECTION
9 Metrics
PROCESSING
Aggregate & Transform
DASHBOARDS
4 Views
ALERTS
Enabled
📊Metrics(9)
📝Logs(Structured)
🔗Traces(Distributed)
ingest_rate_per_sec
anomaly_detection_latency_p95_ms
prediction_accuracy_percent
false_positive_rate_percent
model_inference_time_ms
cmms_api_success_rate

Deployment Variants

🚀

Startup Architecture

Fast to deploy, cost-efficient, scales to 100 competitors

Infrastructure

Serverless (Lambda, Cloud Functions)
Managed databases (RDS, Cloud SQL)
SaaS CMMS (Fiix, UpKeep)
Pre-trained models (no custom training)
Single region
Quick deployment (2-4 weeks)
Low upfront cost ($500-1K/month)
Prove ROI with pilot (10-50 machines)
Limited customization

Risks & Mitigations

⚠️ Sensor data quality issues (noise, drift, calibration errors)

High

✓ Mitigation: Implement data quality checks at edge. Auto-detect sensor drift. Alert maintenance to recalibrate. Use robust feature extraction (e.g., FFT reduces noise impact).

⚠️ False positives causing alert fatigue

Medium

✓ Mitigation: Tune confidence thresholds. Implement evaluator agent to filter low-quality predictions. Track false positive rate as KPI. Retrain model monthly.

⚠️ Integration with legacy SCADA systems

High

✓ Mitigation: Use OPC UA adapters (industry standard). Fallback: manual data export if real-time integration not possible. Budget 2-3 months for integration.

⚠️ Model drift due to changing operating conditions

High

✓ Mitigation: Monitor feature distributions weekly. Retrain model when drift detected (KL divergence >0.15). Implement online learning for gradual adaptation.

⚠️ Regulatory compliance (data residency, audit trails)

Medium

✓ Mitigation: Deploy multi-region with data residency controls. Immutable audit logs (7-year retention). Annual SOC2 audit. GDPR compliance for EU sites.

⚠️ Vendor lock-in (cloud provider, CMMS, SCADA)

Medium

✓ Mitigation: Use open standards (OPC UA, FHIR). Abstract integrations behind adapters. Store data in portable formats (Parquet). Maintain multi-cloud deployment option.

⚠️ Cost overruns at scale (10K+ machines)

Medium

✓ Mitigation: Set cost guardrails ($15/machine/month). Use spot instances for batch training. Compress historical data. Monitor unit economics weekly.

🧬

Evolution Roadmap

Progressive transformation from MVP to scale

🌱
Phase 1Weeks 1-12

Phase 1: Pilot (0-3 months)

1
Deploy on 10-50 machines at single site
2
Validate anomaly detection accuracy (>90%)
3
Integrate with SCADA and CMMS
4
Prove ROI (downtime reduction >30%)
Complexity Level
🌿
Phase 2Weeks 13-26

Phase 2: Production Rollout (3-6 months)

1
Scale to 100-1,000 machines across 3-5 sites
2
Add failure prediction and root cause analysis
3
Implement multi-agent orchestration
4
Achieve <5% false positive rate
Complexity Level
🌳
Phase 3Weeks 27-52

Phase 3: Enterprise Scale (6-12 months)

1
Scale to 1,000-10,000 machines globally
2
Multi-region deployment with failover
3
Federated learning across sites
4
99.9% uptime SLA
Complexity Level
🚀Production Ready
🏗️

Complete Systems Architecture

9-layer architecture from edge sensors to executive dashboards

1
🌐

Presentation

4 components

Plant Manager Dashboard
Technician Mobile App
Executive Analytics Portal
Alert Notification System
2
⚙️

API Gateway

4 components

Load Balancer (ALB/NLB)
Rate Limiter (per machine/site)
Auth Gateway (OIDC/SAML)
API Versioning
3
💾

Agent Layer

5 components

Planner Agent (task decomposition)
Executor Agent (anomaly detection, prediction)
Evaluator Agent (quality checks, false positive filtering)
Guardrail Agent (safety limits, policy enforcement)
Orchestrator (agent coordination)
4
🔌

ML Layer

5 components

Feature Store (derived metrics: FFT, RMS, kurtosis)
Model Registry (anomaly detectors, failure classifiers)
Offline Training Pipeline (batch)
Online Inference Engine (real-time)
Evaluation Loop (drift detection, retraining triggers)
5
📊

Integration

4 components

SCADA Adapter (OPC UA, Modbus TCP)
MES Connector (production context)
CMMS API (work order generation)
Time-Series DB Writer
6
🌐

Data

4 components

Time-Series DB (InfluxDB/TimescaleDB)
Feature Store (Redis/DynamoDB)
Model Artifacts (S3/GCS)
Audit Logs (S3 + Glacier)
7
⚙️

External

4 components

IoT Sensors (edge devices)
SCADA Systems (plant floor)
MES (Manufacturing Execution System)
CMMS (SAP PM, Maximo, Fiix)
8
💾

Observability

4 components

Metrics (Prometheus/CloudWatch)
Logs (ELK/Splunk)
Traces (Jaeger/X-Ray)
ML Monitoring (Evidently AI, Arize)
9
🔌

Security

4 components

Identity Provider (Okta/Azure AD)
Secrets Manager (Vault/KMS)
Network Firewall (VPC/NSG)
Audit Trail (immutable logs)
🔄

Sequence Diagram - Failure Prediction Flow

Automated data flow every hour

Step 0 of 8
SensorEdge GatewayAPIPlanner AgentExecutor AgentEvaluator AgentCMMSStream vibration data (100Hz)POST /ingest (1min batch)Route to anomaly detectionAnalyze(machine_id, timeseries)anomaly_detected=true, confidence=0.92validated=true (not false positive)POST /workorders (failure in 30min)Alert: Motor #42 bearing failure predicted

Data Flow - Sensor to Work Order

1
IoT SensorContinuous
Collect vibration/temp/pressureRaw timeseries (100Hz)
2
Edge Gateway60s
Aggregate 1min batchesCompressed batch
3
API Gateway50ms
Receive POST /ingestJSON payload
4
Feature Store100ms
Extract features (FFT, RMS, etc.)Feature vector
5
Planner Agent50ms
Route to anomaly detectionTask plan
6
Executor Agent200ms
Run anomaly detectorAnomaly detected=true, conf=0.92
7
Evaluator Agent100ms
Validate (not false positive)Validated=true
8
Guardrail Agent30ms
Check safety policyAllowed=true
9
Root Cause Analyzer150ms
Diagnose bearing wearRoot cause + recommended fix
10
CMMS Adapter300ms
Generate work orderWork order #12345
11
Notification System100ms
Alert technicianSMS/email
12
Dashboard50ms
Update real-time viewVisual alert
1
Volume
10-100 machines
Pattern
Pilot - Serverless
🏗️
Architecture
Lambda/Cloud Functions for ingestion
Managed TimescaleDB
Single-region deployment
Pre-trained models (no retraining)
Cost & Performance
$500/month
per month
1-2 sec
2
Volume
100-1,000 machines
Pattern
Production - Containerized
🏗️
Architecture
ECS/Cloud Run containers
Redis for feature cache
TimescaleDB + read replicas
Weekly model retraining
Cost & Performance
$3K/month
per month
500-800ms
3
Volume
1,000-10,000 machines
Pattern
Enterprise - Kubernetes
🏗️
Architecture
K8s cluster (multi-zone)
Kafka for event streaming
Distributed feature store
Auto-scaling inference
Daily model retraining
Cost & Performance
$15K/month
per month
300-500ms
Recommended
4
Volume
10,000+ machines
Pattern
Hyperscale - Multi-Region
🏗️
Architecture
Multi-region K8s
Edge computing (local inference)
Federated learning
Real-time model updates
Geo-distributed data
Cost & Performance
$50K+/month
per month
100-300ms

Key Integrations

SCADA Integration

Protocol: OPC UA (IEC 62541)
Subscribe to machine tags
Receive real-time data stream
Map tags to machine IDs
Store in time-series DB

MES Integration

Protocol: REST API or ISA-95 B2MML
Query production schedule
Get machine utilization
Context-aware predictions (avoid alerts during planned downtime)
Report downtime events

CMMS Integration (SAP PM, Maximo, Fiix)

Protocol: REST API
POST /workorders with predicted failure
Include machine ID, failure type, priority, recommended parts
Poll for work order status
Close loop: record actual failure vs. predicted

Historian Integration (OSIsoft PI, Wonderware)

Protocol: PI Web API or proprietary SDK
Query historical sensor data
Backfill training dataset
Validate model predictions against actuals

Security & Compliance

Failure Modes & Fallbacks

FailureFallbackImpactSLA
Sensor data stream interruptedUse last known good values for up to 5 min, then alertDegraded (no new predictions)99.9%
Anomaly detection model unavailableFall back to rule-based thresholds (vibration >10g, temp >80°C)Reduced accuracy (90% → 75%)99.5%
CMMS API downQueue work orders in local DB, retry every 5 minDelayed work order creation (eventual consistency)99.0%
Feature extraction fails (corrupt data)Skip prediction for that machine, log error, alert data engSingle machine not monitored temporarily99.9%
False positive storm (>10% FP rate)Increase confidence threshold from 0.85 → 0.92, alert opsFewer predictions (higher precision, lower recall)99.5%
Database unavailableRead from replica (read-only mode), queue writesNo new predictions saved, dashboards show stale data99.9%
Network partition (site isolated)Edge inference continues locally, sync when reconnectedNo centralized visibility, local predictions only99.0%

RAG vs Fine-Tuning for Root Cause Analysis

Maintenance manuals and failure reports update constantly. RAG allows daily updates without retraining. Fine-tuning would require monthly retraining ($10K+ each time).
✅ RAG (Chosen)
Cost: $200/mo (vector DB)
Update: Daily
How: Add new maintenance reports to vector DB
❌ Fine-Tuning
Cost: $10K/mo (retraining + compute)
Update: Monthly
How: Retrain BERT on full corpus
Implementation: Vector DB (Pinecone/Weaviate) with maintenance manuals, failure reports, OEM documentation. Retrieved during root cause analysis. BERT model generates diagnosis using retrieved context.

Hallucination Detection in Predictions

ML models hallucinate impossible failures (e.g., bearing failure on machine with no bearings)
L1
Confidence scores (<0.85 = flag for review)
L2
Machine type validation (check failure type matches machine components)
L3
Physics-based checks (e.g., vibration frequency must match RPM harmonics)
L4
Human-in-the-loop for low-confidence predictions
0.5% hallucination rate, 99.5% caught before work order generation

Evaluation Framework

Anomaly Detection Accuracy
94.2%target: 95%+
Failure Prediction Recall
91.3%target: 90%+
False Positive Rate
4.1%target: <5%
Time to Failure (TTF) MAE
8.2 mintarget: <10 min
Root Cause Accuracy
87.1%target: 85%+
Testing: Shadow mode: Run predictions in parallel with existing maintenance process for 3 months. Compare predicted failures vs. actual failures. Measure downtime reduction.

Dataset Curation

1
Collect: 50K machine-hours of sensor data - Historical SCADA data + maintenance logs
2
Label: 5K labeled failures - ($$50K)
3
Augment: +10K synthetic failures - Physics-based simulation (FEM, vibration models)
4
Clean: 60K usable examples - Remove sensor errors, outliers, incomplete records
60K high-quality labeled examples. Inter-annotator agreement (Cohen's Kappa): 0.89.

Agentic RAG for Root Cause Diagnosis

Agent iteratively retrieves context based on reasoning
Anomaly detected: high vibration. Agent retrieves: (1) Machine manual → identifies bearing type. (2) Maintenance history → last bearing replacement 18 months ago. (3) Similar failures → 80% were bearing wear. (4) Physics model → vibration frequency matches bearing defect frequency. Agent synthesizes: 'Likely bearing wear. Recommend replacement. Confidence: 0.92.'
💡 Not one-shot retrieval. Agent decides what else it needs to know, iteratively refines diagnosis.

Federated Learning for Multi-Site Deployment

Tech Stack Summary

Edge/IoT
MQTT brokers (Mosquitto, HiveMQ), OPC UA clients, Edge gateways (AWS IoT Greengrass, Azure IoT Edge)
Ingestion
Kafka, AWS Kinesis, or Google Pub/Sub
Time-Series DB
InfluxDB, TimescaleDB, or AWS Timestream
Feature Store
Redis (real-time), DynamoDB, or Feast
ML Training
Python (scikit-learn, TensorFlow, PyTorch), MLflow for tracking
ML Inference
TensorFlow Serving, TorchServe, or SageMaker
Agent Orchestration
LangGraph, CrewAI, or Apache Airflow
CMMS Integration
REST APIs (vendor-specific SDKs)
Observability
Prometheus + Grafana, Datadog, or CloudWatch
Security
Okta/Azure AD (SSO), Vault (secrets), KMS (encryption)
Compute
Kubernetes (EKS/GKE/AKS), Lambda/Cloud Functions (serverless)
🏗️

Need Architecture Review?

We'll audit your predictive maintenance system, identify bottlenecks, and show you how to scale from 100 to 10,000 machines.

©

2026 Randeep Bhatia. All Rights Reserved.

No part of this content may be reproduced, distributed, or transmitted in any form without prior written permission.